
Based on my crash statistical probability analysis (SCPA) the probability is 87.5% that the stock markets of the US and the five other leading developed countries, which have been crashing since February 20, 2020, have reached an interim bottom.
If the interim bottom has been made the statistical probability is 100% that the stock markets of the US, Japan, Germany, Canada, South Korea and France will experience powerful interim rallies that will result in double digit percentage gains as compared to their 2020 lows. This will occur within days of the interim low being made. What will likely drive the rallies for all of the markets before they reverse to plumb to new lows is the US Congress passing a virus stimulus plan. A deceleration of the growth rate of new Coronavirus cases could also result in a quick and powerful relief rally.
The probabilities and percentage increase targets in the above paragraphs were derived from my crash statistical probability analysis (SCPA). The analysis was explained in two of my recent articles which warned my readers to get out of the market. As of March 23, 2020, the S&P had declined by 26% as compared to its closing price at March 6, 2020:
“US Stock Market to decline by another 22% by Easter”, March 6, 2020
“2020 Crash is third ‘Category 5 Hurricane’ in 90 years! Get out of market today!”, March 9, 2020
The new 2020 low made by the S&P 500 for today, March 23rd was poignant and increased the probability from 75% to 87.5% that the markets are near their interim bottoms. It’s because the S&P 500 broke through the crash probability analysis’s 34% correction threshold. My articles of March 6th and March 9th explained the threshold’s significance. The articles also made two very precise predictions for the markets of the crash inflicted countries that were relative to the threshold:
- 34% declines from their 2020 highs
- declines to occur by March 21, 2020
When the predictions were published on March 6th, the corrections from their 2020 highs had ranged from 11% to 17%. By March 18th, an index for each of the six countries had declined to or through the 34% threshold. South Korea and France were added after both of the articles were published. However, two of the US’ indices, the S&P 500 had not corrected by 34%. The S&P 500 breached the threshold as of today (3/23/20) and got to 35.4% below its 2020 high. The NASDAQ’s correction from its 2020 high is at 33.0%.

Upon the bottoms for the markets being made the SCPA (statistical crash probability analyses) is forecasting the following:
- Relief rallies of 18% to 23% from the bottom
- Post relief rally declines to interim bottom 52% below 2020 highs
- Post interim bottom rally to within 17% of 2020 highs
- Final crash bottoms in Q4 of 2022 with declines of 79% to 89% below 2020 highs
My ability to make such precise and accurate predictions is from my experience at conducting empirical research on extreme market anomalies that I have witnessed throughout my 42-year career. The findings from my research are used to develop and power predictive algorithms which are utilized to predict similar extreme events in the future. The table below contains my algorithms which protect investors and enable them to make money in volatile and bear markets.

If it is not already, the 2020 crash will be recognized by historians as the most infamous stock market crash. It’s the grand-daddy of all market crashes. The markets of more than one country beginning their crashes simultaneously after reaching all-time highs, then beginning their crashes the very next day is unprecedented. The markets of three countries, Germany, Canada and the US reached all time highs on February 19, 2020. They then began their violent corrections that became crashes on February 20th, the very next day.
Since February 28th I have been working 18 hours a day to conduct empirical research on the five most infamous US stock market crashes listed in the table below. My efforts yielded a significant breakthrough. The two crashes, which were by far the most lethal, 1929 and 2000 had the same genealogy as the crashes that have been underway for the six developed countries since February 20, 2020. The history for the two crashes was virtually identical For example, the Crash of 1929 bottomed after 32 months and the NASDAQ 2000 bottomed after 31 months.

Based on my ongoing empirical research efforts regarding these same six countries, the statistical probability is 100% for the following events:
- The markets will have declined by a minimum of 79% when they bottom.
- The markets will bottom in fourth quarter of 2022.
- It will take at least 15 years for the markets to return to their 2020 highs.
My follow on article dated March 9th “2020 Crash is third ‘Category 5 Hurricane’ in 90 years! Get out of market today!”, was about the 2020 crash being equivalent to a “Category 5” designation which is assigned to only the most intense hurricanes. To elaborate on this article, the discovery of the genealogy, statistical probabilities and pathology to identify lethal market crashes are analogous to a hurricane’s genealogy, statistical probabilities and pathology.
Unlike the stock market which has 100 years of available data, the ability to conduct empirical research on hurricanes only became available after the first plane few into the eye of a hurricane in 1943 to collect its barometric pressure. Since then, the forecasting of hurricanes has become increasingly accurate. The intensity, geographical location and arrival times for a hurricane are very predictable. The result has been a significant reduction in hurricane fatalities.

The same forecasting can now be done for market crashes. Instead of comparing barometric pressure readings, the Statistical Probability Analysis measures the degree of price volatility for market corrections which have the potential to become devastating crashes. For a market to have the same genealogy as the 1929, 2000 and 2020 crashes, it must reach a specified percentage decline threshold within a consecutive-daily-declines period.
The chart below covers four NASDAQ crashes. The 2000 and 2020 category 5s experienced minimum corrections of 10% within days of their all-time highs. The 2018 crash is not a Category 5 since its initial decline was less than 10%. Finally, the 2008 crash unlike the other three, did not occur after an all-time new high. The NASDAQ and the S&P 500 peaked in October 2007.

The chart patterns for the indices of the five other countries including Japan, Canada, South Korea and France from February 19th to February 28th are almost identical. The patterns for the Dow 1929 and the NASDAQ 2000 indices for the week to 10-day periods prior to their corrections becoming crashes were eerily similar.
Deep research into the post-crash-to-the-final-bottom history for the 1929 and 2000 crashes enabled the identification of shared statistical probabilities and patterns. The findings were then utilized to develop the indicated pathology for crashes of 1929, 2000 and 2020 as well as the projected pathology for all future crashes which have the same genealogy.
The pathology and statistical probability analyses are now in the process to be programmed as crash tracking and post event forecasting algorithm. The algorithm will monitor all markets which are ripe for a crash. It will automatically issue get-out-of-market warnings for future crashes. Finally, and most importantly, the crash tracking algorithm will forecast the following events and additional events as they unfold organically and after a crash has commenced:
- Interim low date range and target: enable those with cash to buy the market at the low and sell at the interim high before market reverses to make its final bottom
- Interim high date range and target: enables those who did not get out to sell out at higher prices
- final bottom and date range for final bottom: enables long term by and hold investors to invest in something else while waiting for a bottom and reduces risk of buying prematurely and before bottom occurs
- number of years for a market that has endured a devastating crash to exceed pre-crash all-time high
We are currently working as fast as we can to get a website developed for the algorithm. The event forecasts for the 2020 crashes needs to be available to all investors as soon as possible. My fear is that the declines for the markets of these six countries could happen much faster and be much deeper than the 1929 and 2000 crashes. The probability of the first worldwide economic depression ever could occur.
In the meantime, it is highly recommended that investors immediately engage a registered investment advisor (RIA) to assist in liquidating securities at the highest prices. This will enable losses to be minimized. Time is of the essence. Many of the stock market’s biggest spikes over the past 100 years have occurred after crashes and at the beginning of secular bear markets.
For maximum performance an advisor approved by BullsNBears.com should be engaged. It’s for three reasons:
- The advisor will need access to our proprietary statistical probability event forecasts. The forecasts are utilized to obtain the highest prices for liquidations as well as significant profits from trading.
- To obtain maximum liquidation prices the advisor must be experienced at technical trading.
Any advisor we refer will have access to the Bull & Bear Tracker. It’s a great investment vehicle in especially volatile markets since it trades inverse ETFs. For the first 20 days of March it produced a cumulative cash on cash gain of 30%. See, “Bull & Bear Tracker’s performance spectacular”, March 22, 2020.

To be referred to an advisor click the button below
Note. Anyone who trades the initial interim rally after the interim bottom has been made should enter good till cancel limit orders limit orders at prices which are 12% above the 2020 crash’s interim bottom. The recommended limit prices based on the crash probability analysis should be no more than 12% above the 2020 intra-day low.

My prediction is that the S&P 500’s secular bull market which began in March 2009 ended on February 19, 2020. The ninth secular bear since 1802, began on February 20, 2020. Based on the peaks of the last three secular bull markets as compared to the troughs of the of the three most recent secular bears, the S&P 500 could decline by an additional 47% to 80% from its March 6, 2020 close.
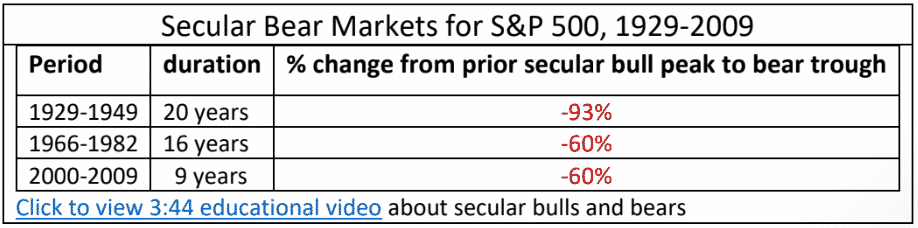
The video of my “Secular Bulls & Bears: Each requires different investing strategies” workshop at the February 2020 Orlando Money Show is highly recommended. The educational video explains secular bulls and bears and includes strategies to protect assets during secular bear markets and recessions, etc.
BullsNBears.com which covers all of the emerging and declining economic and market trends is an excellent resource site. Click here to view one-minute video about the site
The 3:53 video below is about my track record for predicting bankruptcies, market crashes and rallies off of crash-bottoms.
(Video below has been updated on Aug 2024)

Written by: Michael Markowski @BullsNBears.com
The post “Probability is 87% that market is at interim bottom” first appeared on BullsNBears.com