
There’s an old adage among market technicians on Wall Street when looking at the S&P 500 Index: “Nothing good happens below the 200-day moving average.”
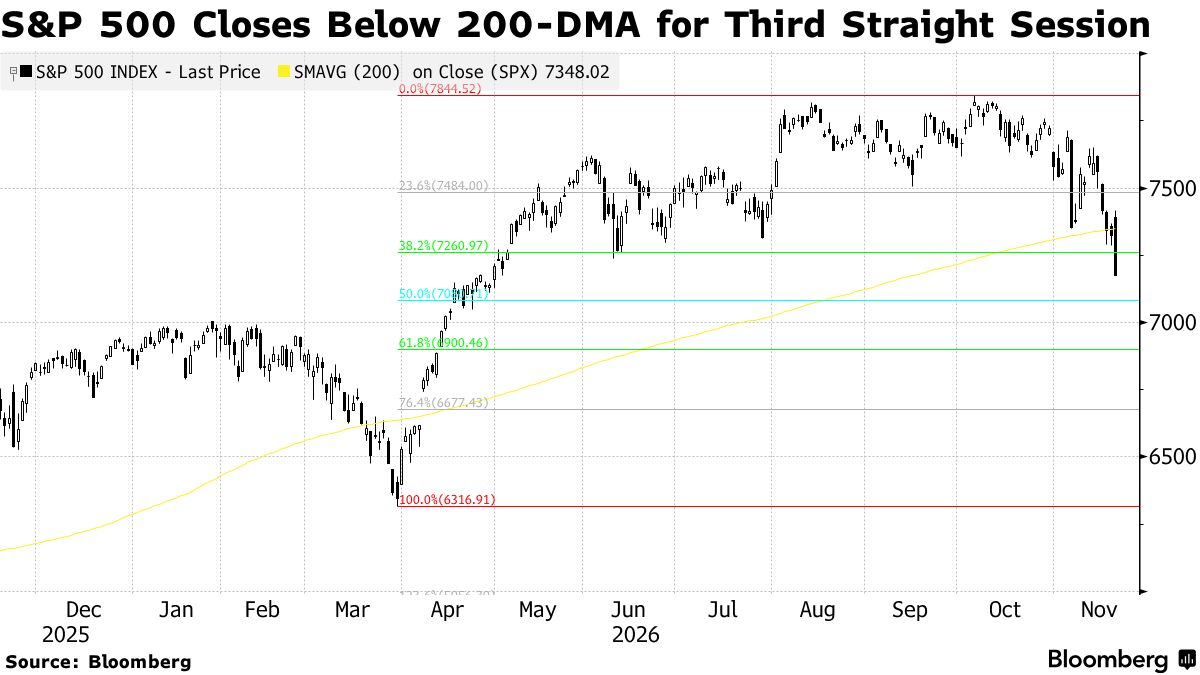
The US equities benchmark tumbled through the level to fall below 7,200 on Thursday, breaching support levels that stopped selloffs in June and July. Just two days earlier, the index had broken its 200-day moving average around 7,348 for the first time since April. It’s now near a major structural floor between a rebound and a deeper year-end pullback.
Chart watchers are scouring for the next technical clues on whether the worst of the selloff is over. That’s as the Nasdaq 100 Index has tumbled more than 15% from its Oct. 6 peak.
“While we’re price focused, we can’t be blind to all of the key market-moving catalysts this week from Nvidia earnings to Anthropic’s IPO, so we can’t push any bets too hard in any direction right now,” said Andrew Thrasher, a technical analyst and senior portfolio manager at Financial Enhancement Group. “What got us here? The AI trade is coming out of the bubble and tech is bleeding.”
The S&P 500 has suffered its first back-to-back 1% drops since March this week, as investors fret over technology company valuations, geopolitical turmoil and rising interest rates. For chart watchers, this is the time technicals and positioning are taking over the near-term stock-market price action, exposing key thresholds.
A few hurdles remain before confirmation that the index’s uptrend is broken. Thrasher is looking at whether the S&P 500 will continue to close below the 200-DMA for multiple sessions, which it already did three days in a row this week. It’s the 22nd such instance since 2005, Thrasher said.
While historically, that creates more selling pressure, it bodes well for stocks in the short-run. The index was higher 62% of the time 10 days after multiple 200-DMA breaches and 71% of the time 21 days later, he said.
The S&P 500 also broke below its one-year moving average around 7,249, which smooths out short-term volatility and seasonal noise. On the way, the benchmark took out its June lows around 7,237, to close at 7,175.83 Thursday, sinking more than 5% this month and heading for its worst November since 2008.
It’s now flirting with a correction level a hair below 7,040, after tumbling more than 8% from its October record. There are a few levels before that key psychological threshold to lure dip buyers, according to technical analysts, who monitor daily averages and other metrics to determine market momentum.
Mark Newton, head of technical strategy at Fundstrat Global Advisors, is watching 7,160 — where the S&P 500 will mark two equal legs down, from Oct. 6 through Nov. 5, and from Nov. 12. For traders who follow Fibonacci analysis, 7,080 represents a 50% retracement of the peak-to-trough decline from March intraday lows to October highs.
Market technicians monitor retracement levels based on Fibonacci numbers to identify points of support and resistance where stock prices potentially reverse direction.
“I think we’re actually close to putting in a low,” Newton said. “Thursday’s early reversal back down should help to create a low into Friday.”
To John Kolovos, head of technical strategy at Macro Risk Advisors, this is a sign stocks aren’t out of the woods yet. More trouble could lie ahead after the benchmark also broke below its early November lows around 7,350. Futures on the S&P 500 Index dropped 1.3% at 8:36 a.m. in New York, while contracts on the Nasdaq 100 are down 2.2%.
Kolovos is watching 7,000 for potential support, the first-quarter highs, after the S&P 500 fell below its intraday low of 7,270 June 9 on Thursday. That would imply a roughly 2.5% drop from current levels. For resistance, he’s eyeing 7,515 — a 61.8% retracement since last week’s highs and near Monday’s high — and then the 50-DMA near 7,640.
As a line in the sand for bears to take control, Kolovos is monitoring 7,170 — a measured move target that is slightly below the July lows — to allow for some extra wiggle room before condemning the market to 7,000, he says. After that, 6,900 would serve as a longer-term support level that provided resistance for the equities gauge at the start of the year.
“Key cyclical stocks are all testing meaningful resistance, while tech attempts to recover from washout conditions, but defensive leadership, weak speculative appetite, and a challenging macro backdrop continue to argue for caution,” Kolovos said.
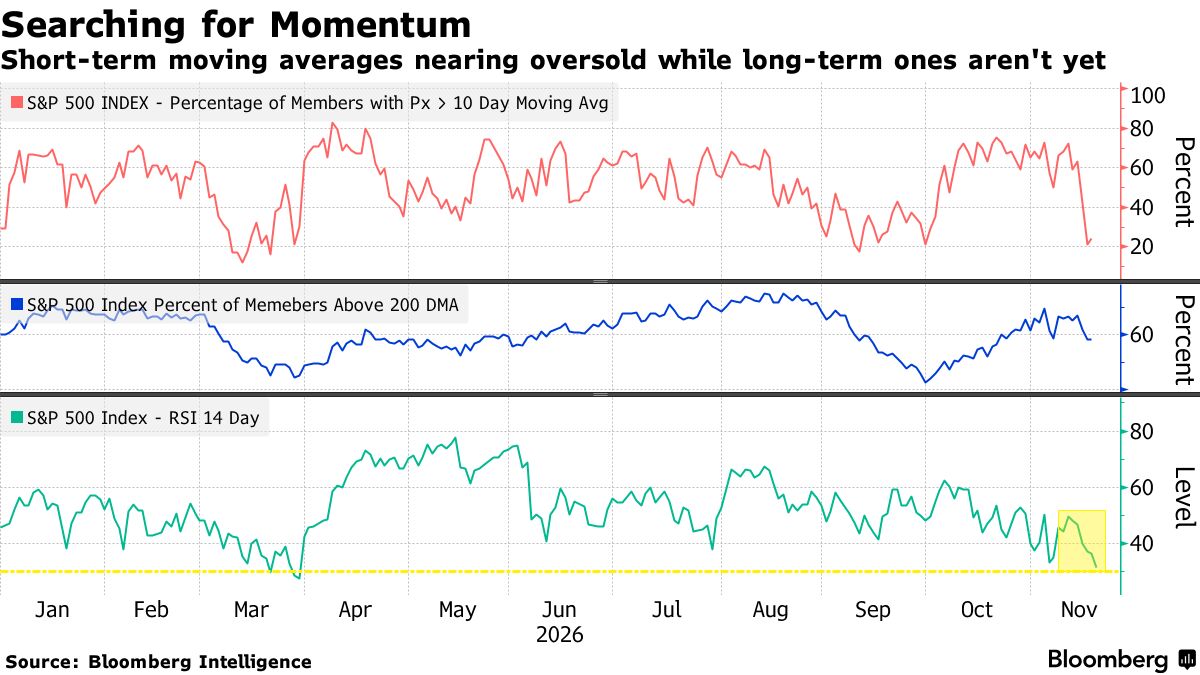
The percentage of stocks in the benchmark gauge that are trading above their 200-day moving averages sits at 49% — over two times April 2025 levels after the S&P 500 touched its low for that year after the tariff turmoil.
There are signs stocks have become oversold. The S&P 500’s 14-day relative strength index stood at 31 — nearing the key 30 level for the first time since March. Just 9% of the index’s shares are above their 10-DMAs, another sign that investors may have turned overly bearish in the short run.
Chart watchers deem stocks as oversold when prices fall too far, too fast, leaving little room to move even lower.
“Most of the action in the past months has been ‘buy the dip’ mantra, where every selloff was chance to buy stocks lower,” said Jason Coogan, a floor trader at Simplex Trading, noting that it’s now the opposite. “Every rally is being sold.”
Written by: Jess Menton @Bloomberg
The post “S&P 500 Faces Technical Make-or-Break Moment Below 7,200 Line” first appeared on Bloomberg